
CASE 03 · AMERICAN EXPRESS · AMEX ADVANCE
Turning predictive data into decisions partners could act on.
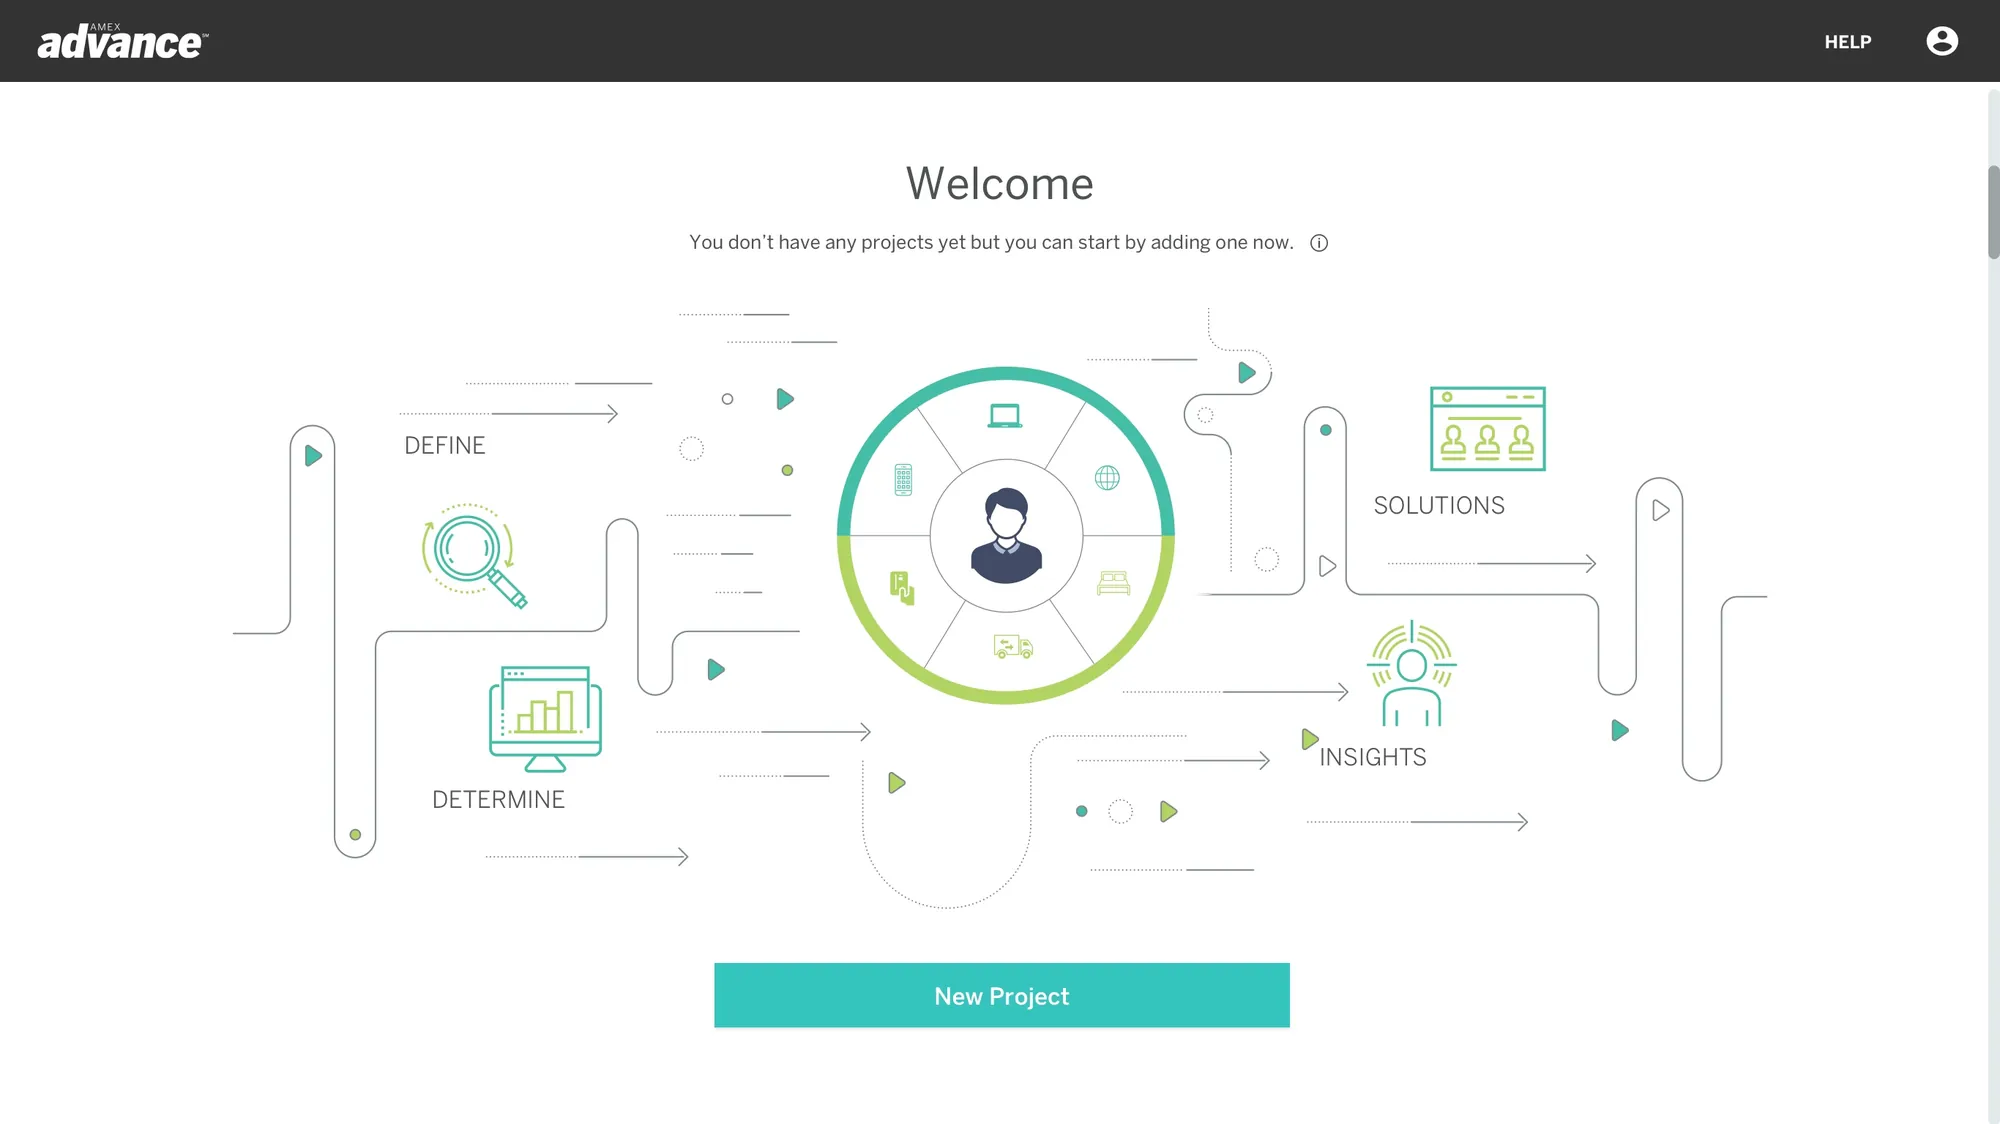
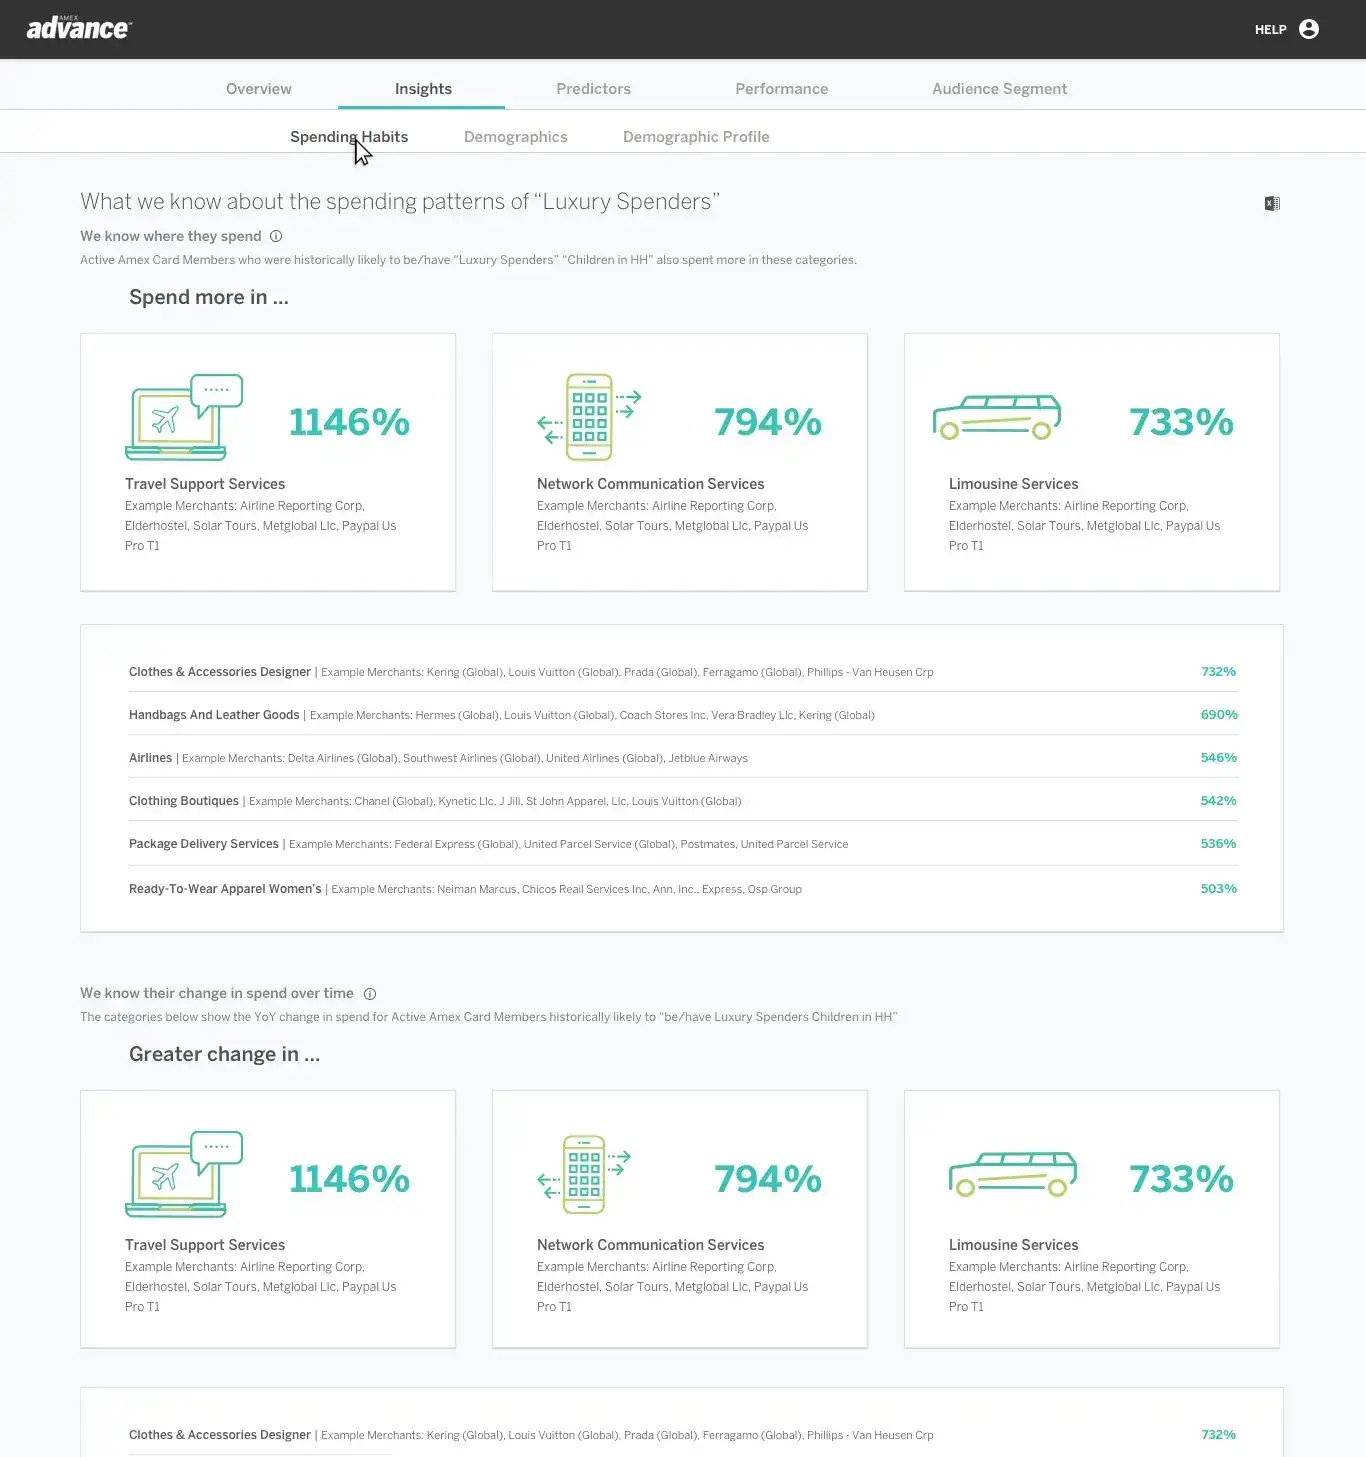
I led the product design of a new data platform that lets American Express partners build, understand and order predictive audiences.
01 · THE PROBLEM
Powerful models, used by people who needed to decide fast.
American Express wanted partners to use its transaction data and predictive models to find new customers. The models were powerful. The people using them were marketers who needed to make a call quickly and move on.
Amex Advance took American Express data beyond its own walls for the first time. Behind it sat transaction data, predictive modeling, audience segmentation and performance reporting. None of that complexity could leak into the experience. A partner had to get from "I have a goal" to "I've ordered an audience" without needing a data scientist next to them.
The design challenge was to make a sophisticated platform understandable without making it feel simplistic.
02 · MY ROLE
Where did I sit?
Lead designer, next to the developers from day one.
I was the Lead UX/UI Designer on the product. I owned research, information architecture, interaction design, data visualization and the visual identity of the interface, and worked day to day with business stakeholders and the development team.
Because the technology was new, I worked with the developers from the start to understand what the models could and couldn't do, so the design grew from real capabilities and constraints.
03 · HOW I WORKED THROUGH IT
From features to decisions.
Every screen had to answer one question: what does the partner need to decide here, and what do they need to see to decide it?
STEP A
Listen and align
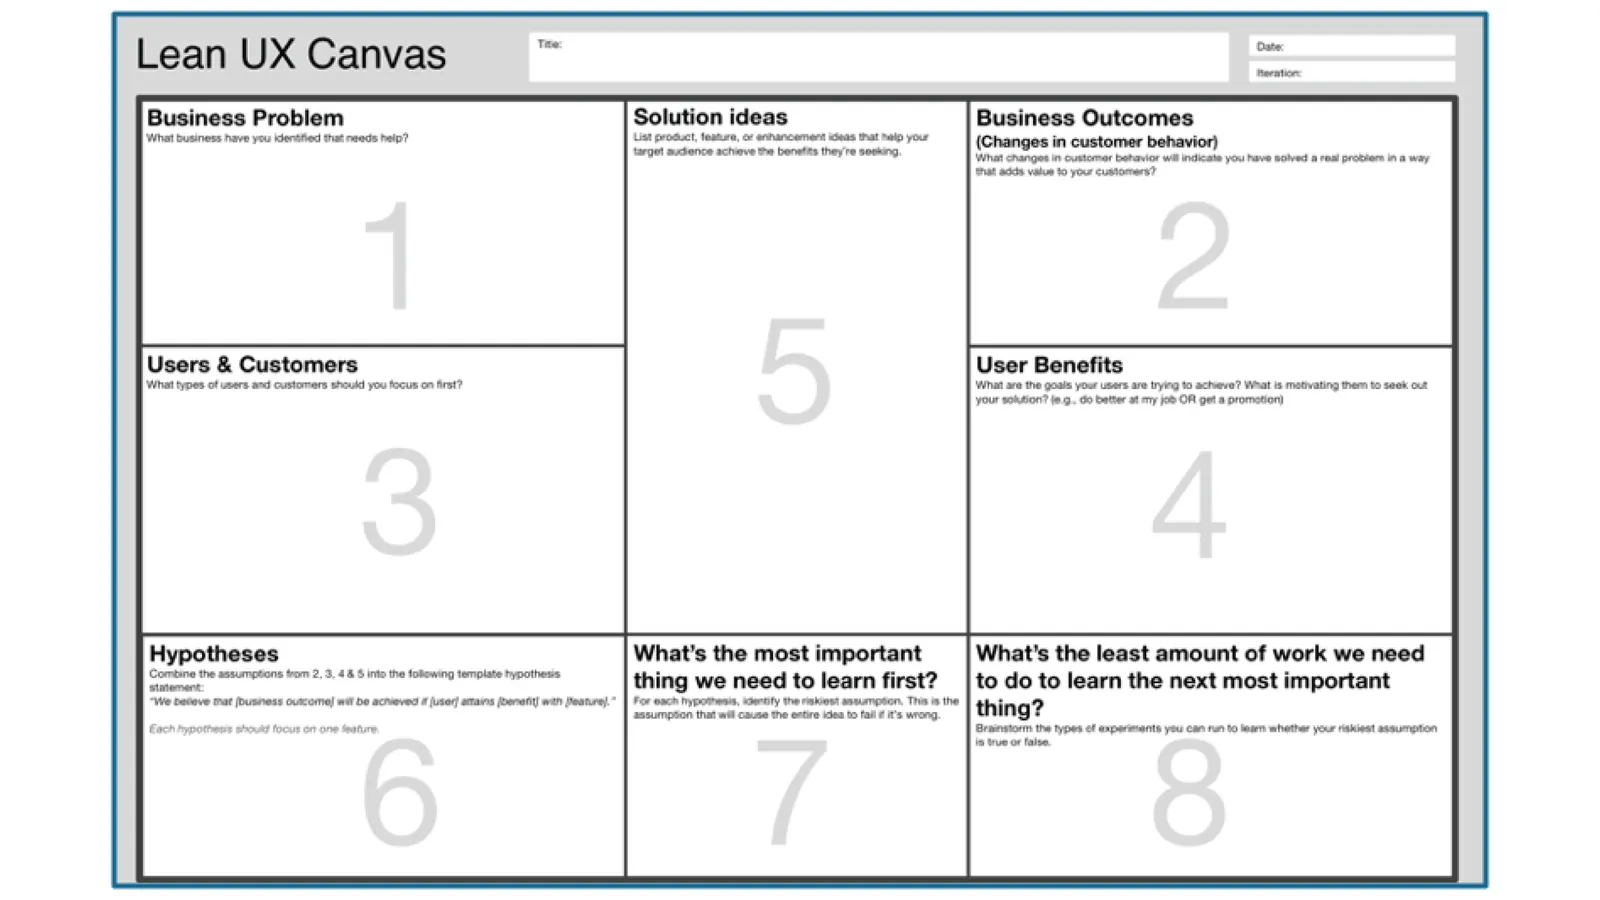
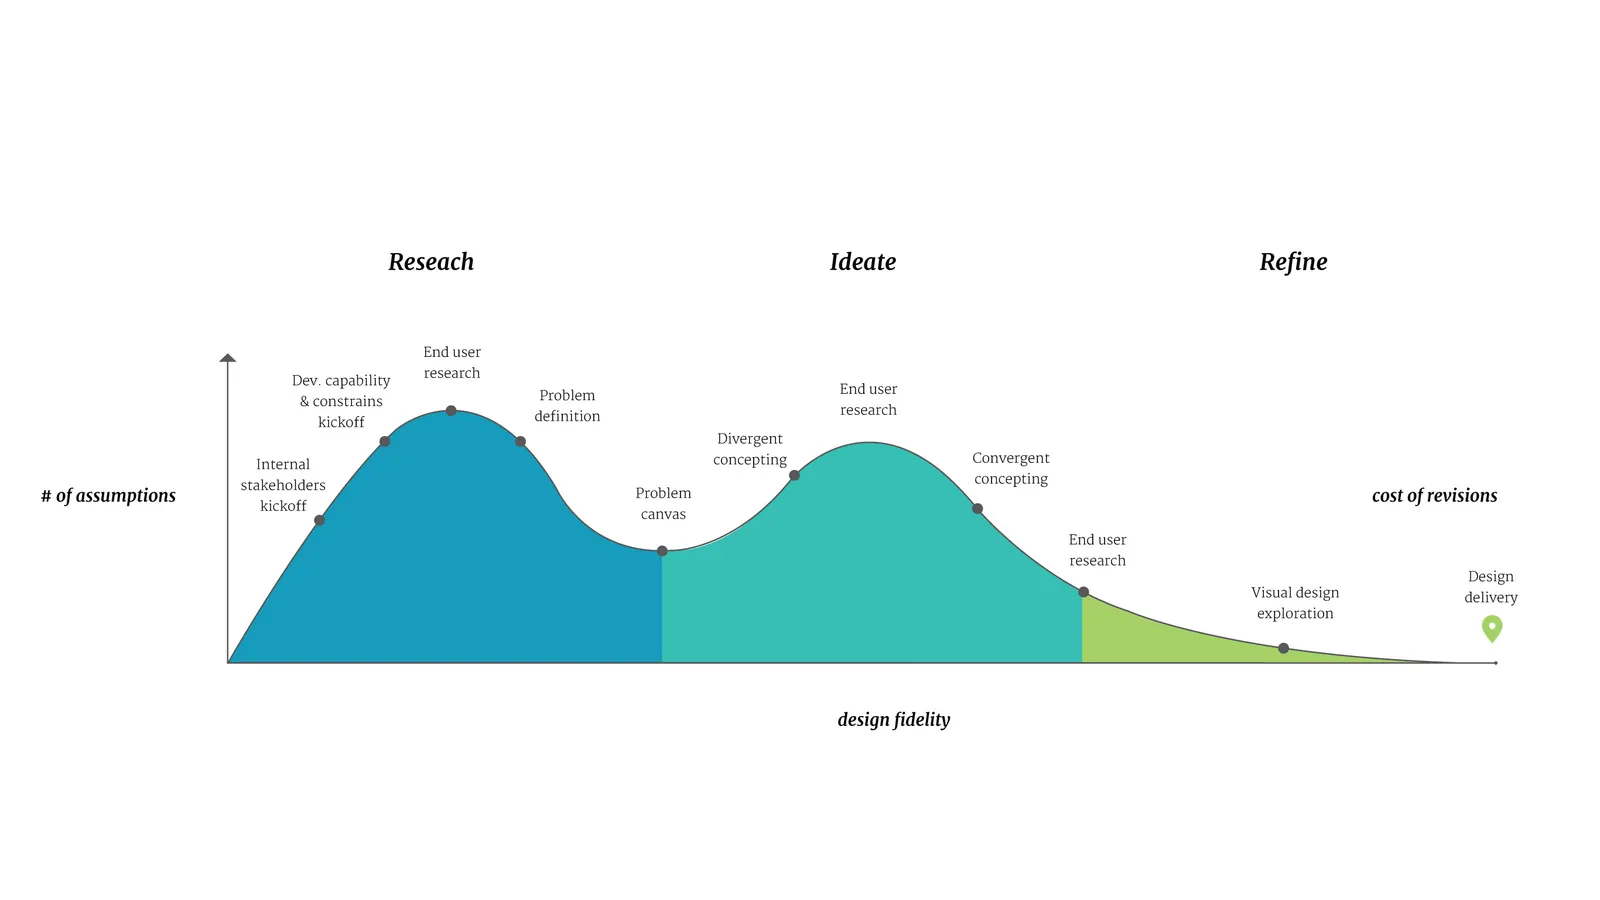
Stakeholder sessions set the business goals, success criteria, technical landscape and dependencies. A Lean UX canvas kept assumptions visible so we could test them instead of arguing about them.
STEP B
Understand the user
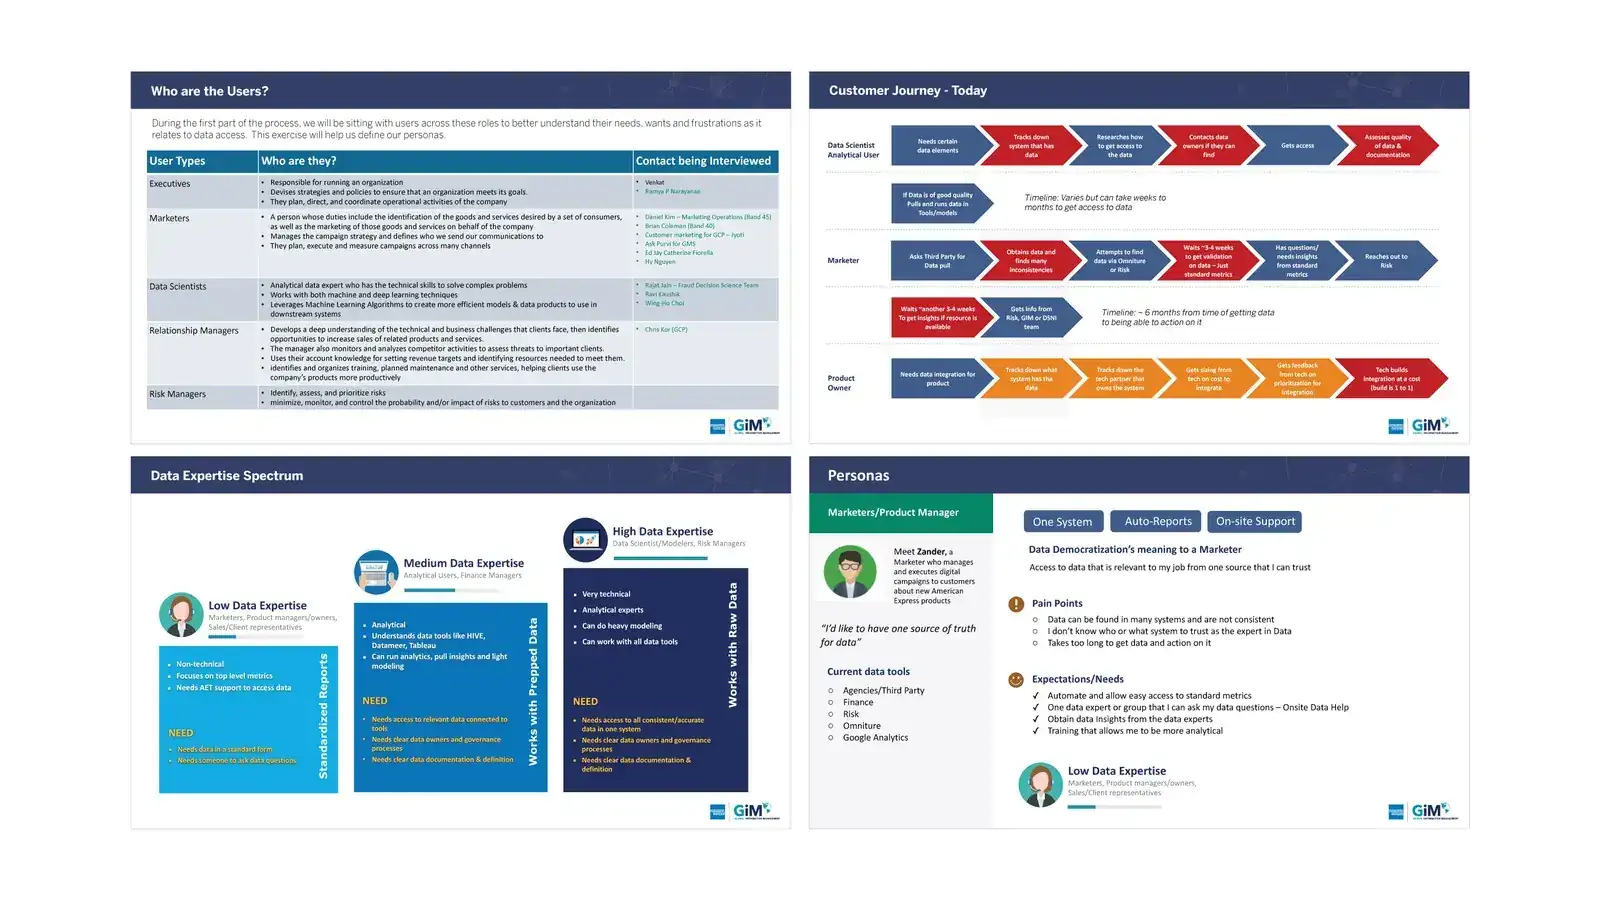
Research sessions showed how partners thought about audience building, how they read data, and where unfamiliar concepts made them hesitate.
STEP C
Define the model
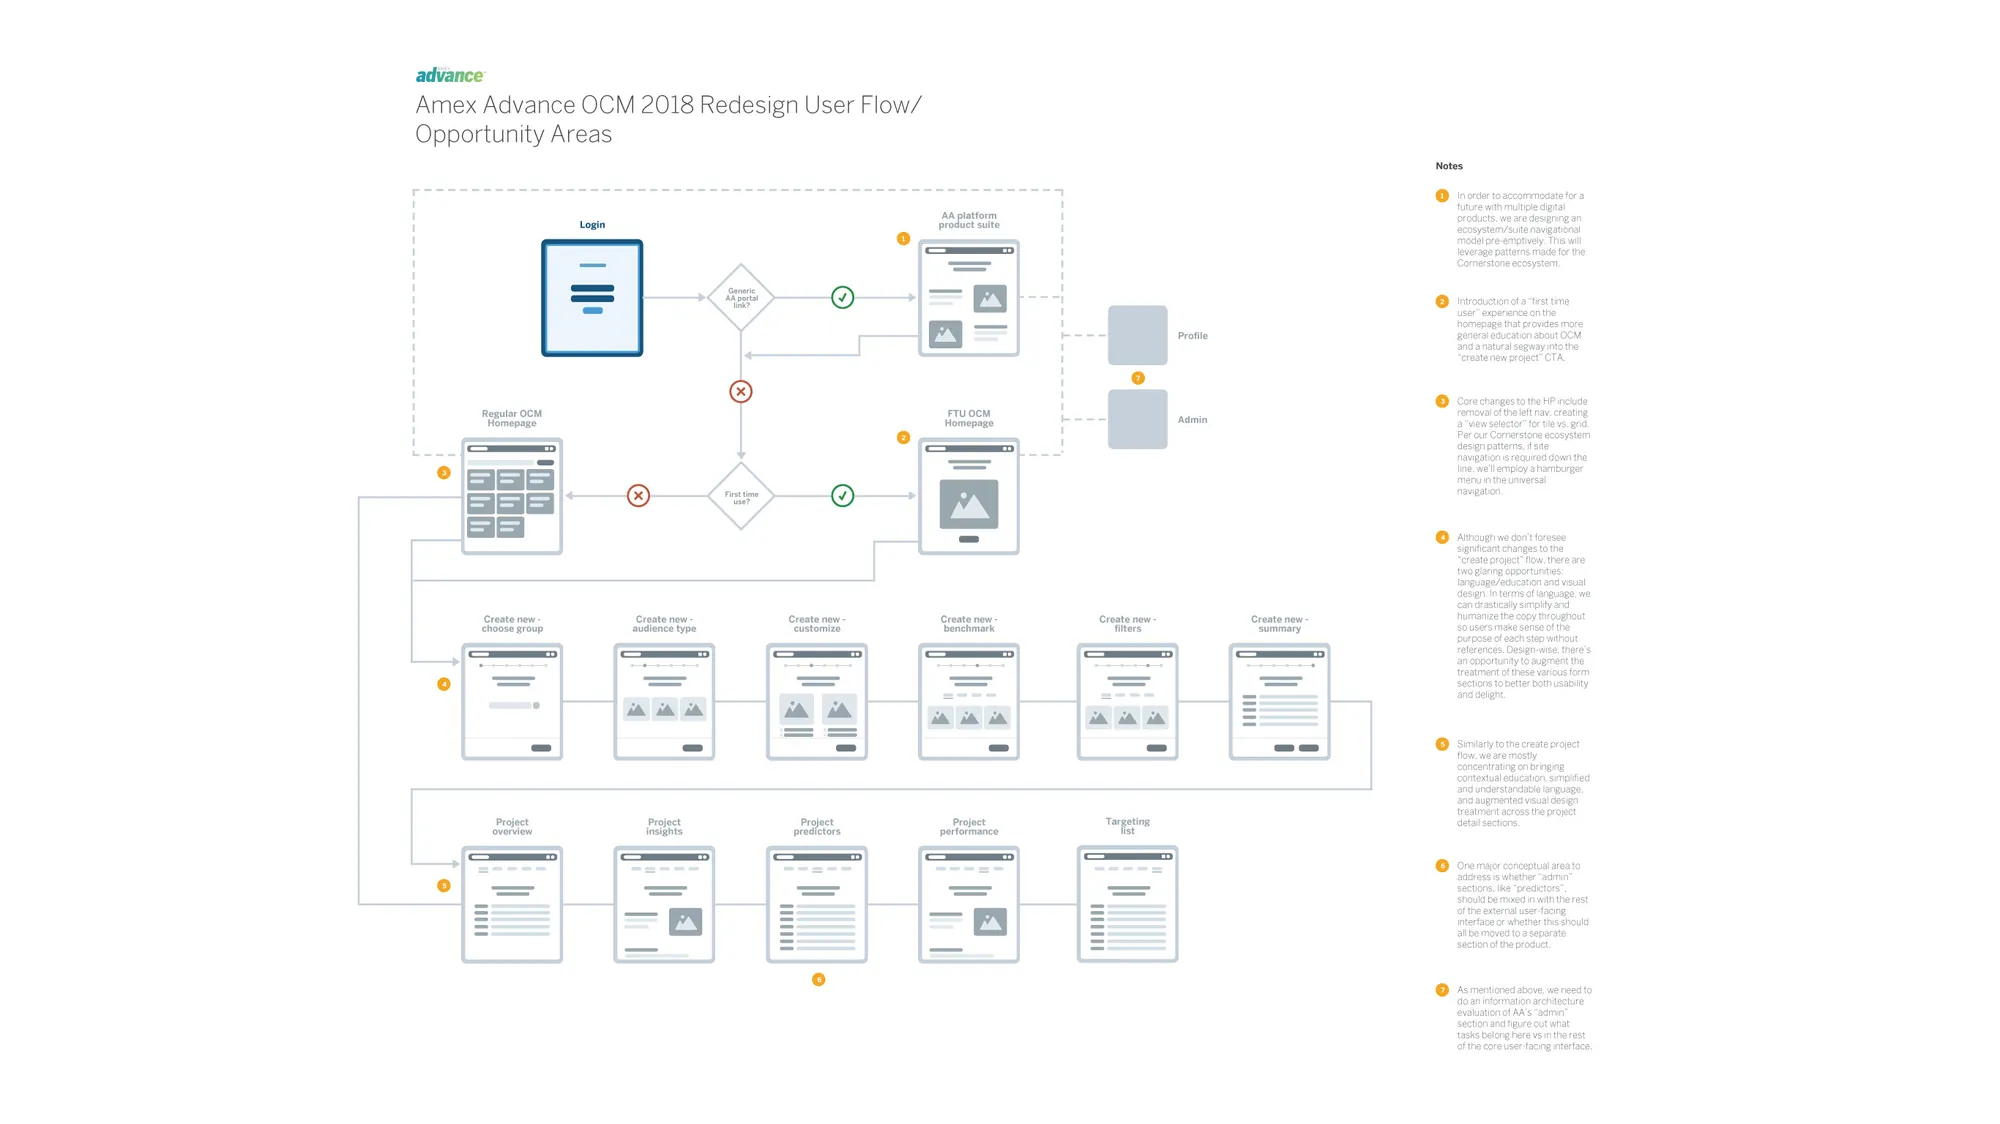
I structured the product around one end-to-end path users could hold in their heads before meeting the full depth of the platform.
STEP D
Explore cheaply, then test
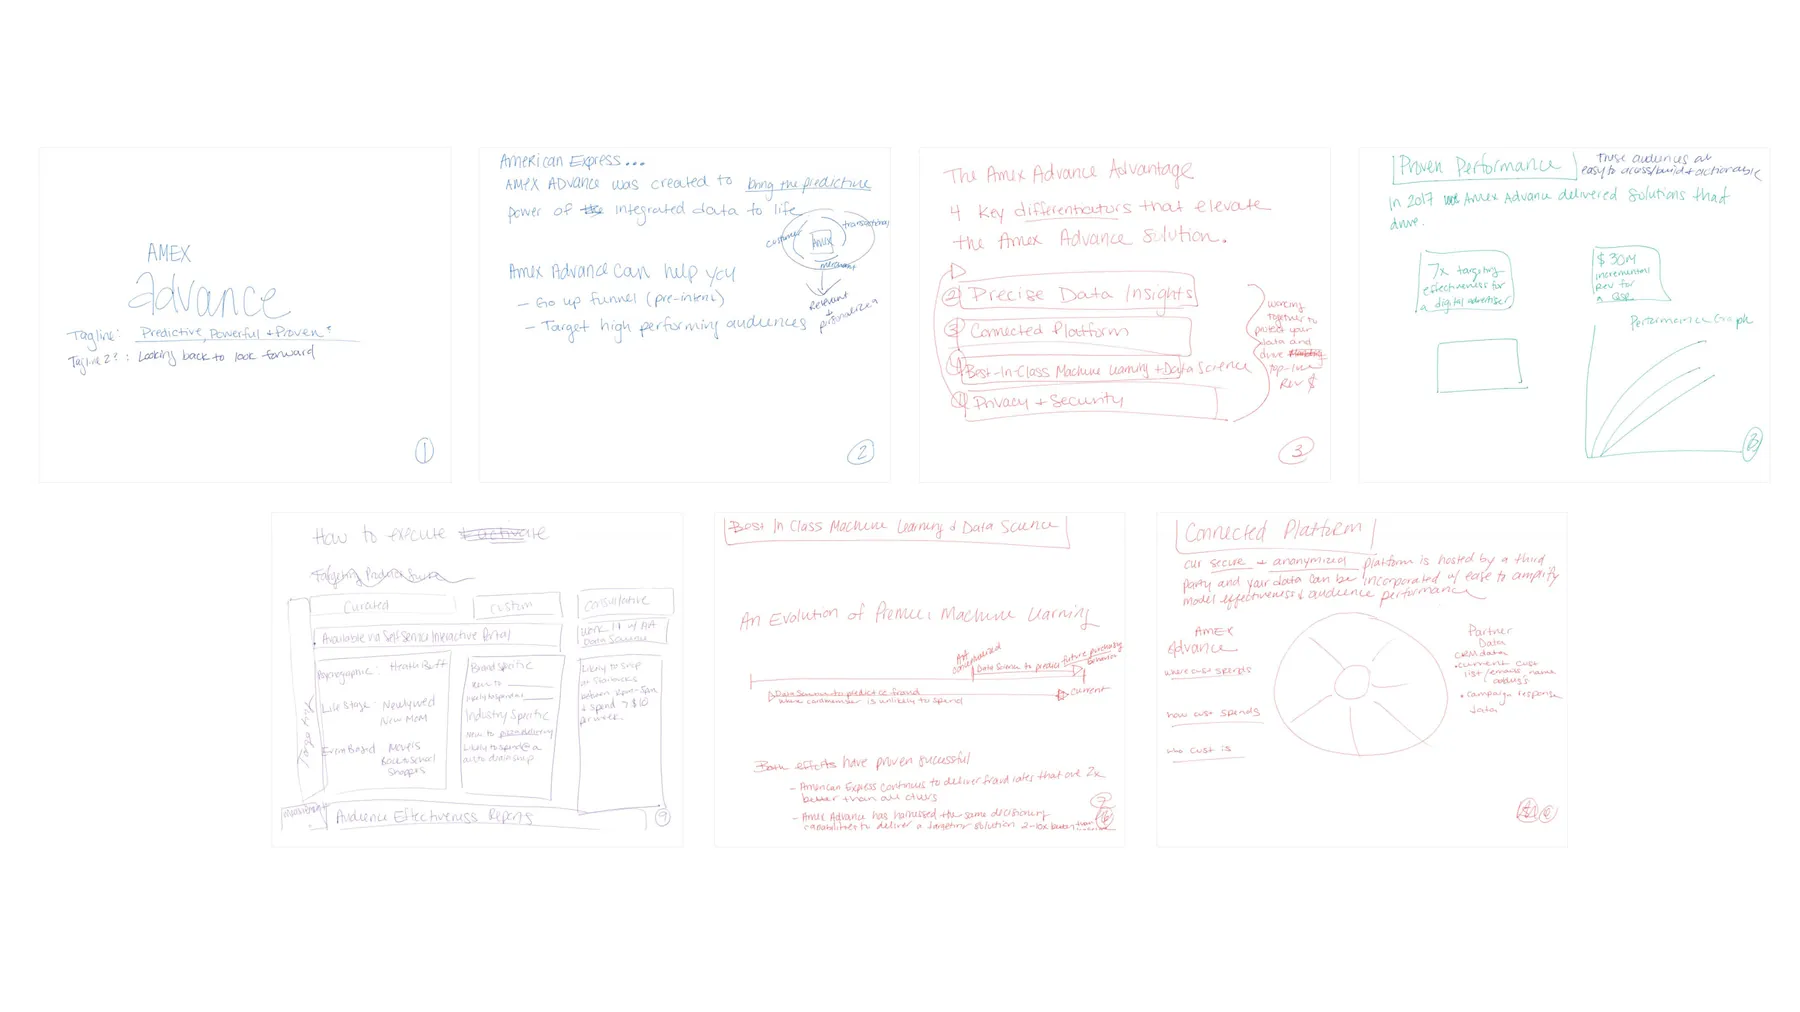
Sketches and low-fidelity wireframes let us compare interaction models in days, and user feedback picked the patterns that felt intuitive.
STEP E
Refine
The chosen direction moved through mid and high fidelity, with end-to-end prototypes tested before the final visual layer went on.
04 · WHAT RESEARCH TOLD US
The research changed the questions we asked.
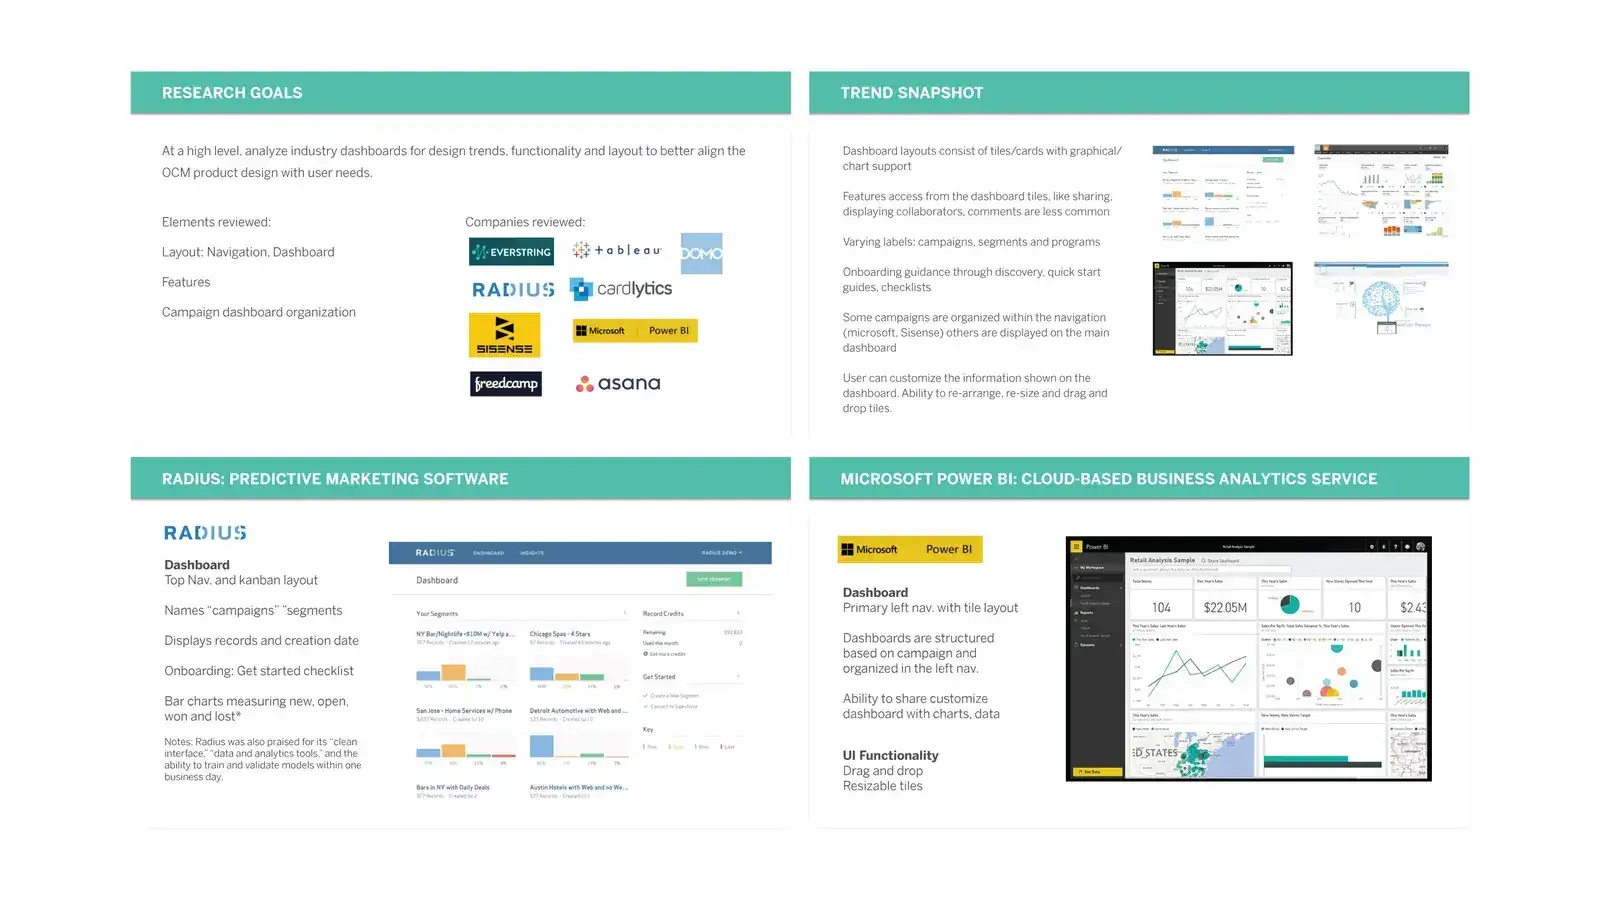
The research went past "can they finish the task." We looked at how partners approached audience creation, what they expected from a data product, and where unfamiliar ideas became barriers. Early sessions were open discovery. Later ones put concepts and then working prototypes in front of users, so confidence grew as the product took shape.
We stopped debating which features to add and started asking which decisions each screen had to support.
05 · STRUCTURE FIRST, POLISH SECOND
In a product this dense, the real work was the architecture.
I tested different ways to organize projects, insights, audience settings and outputs so users could form a clear mental model of how the platform worked.
- 01
Create a project
- 02
Read the insights
- 03
Select an audience
- 04
Order and manage
06 · THE PRODUCT
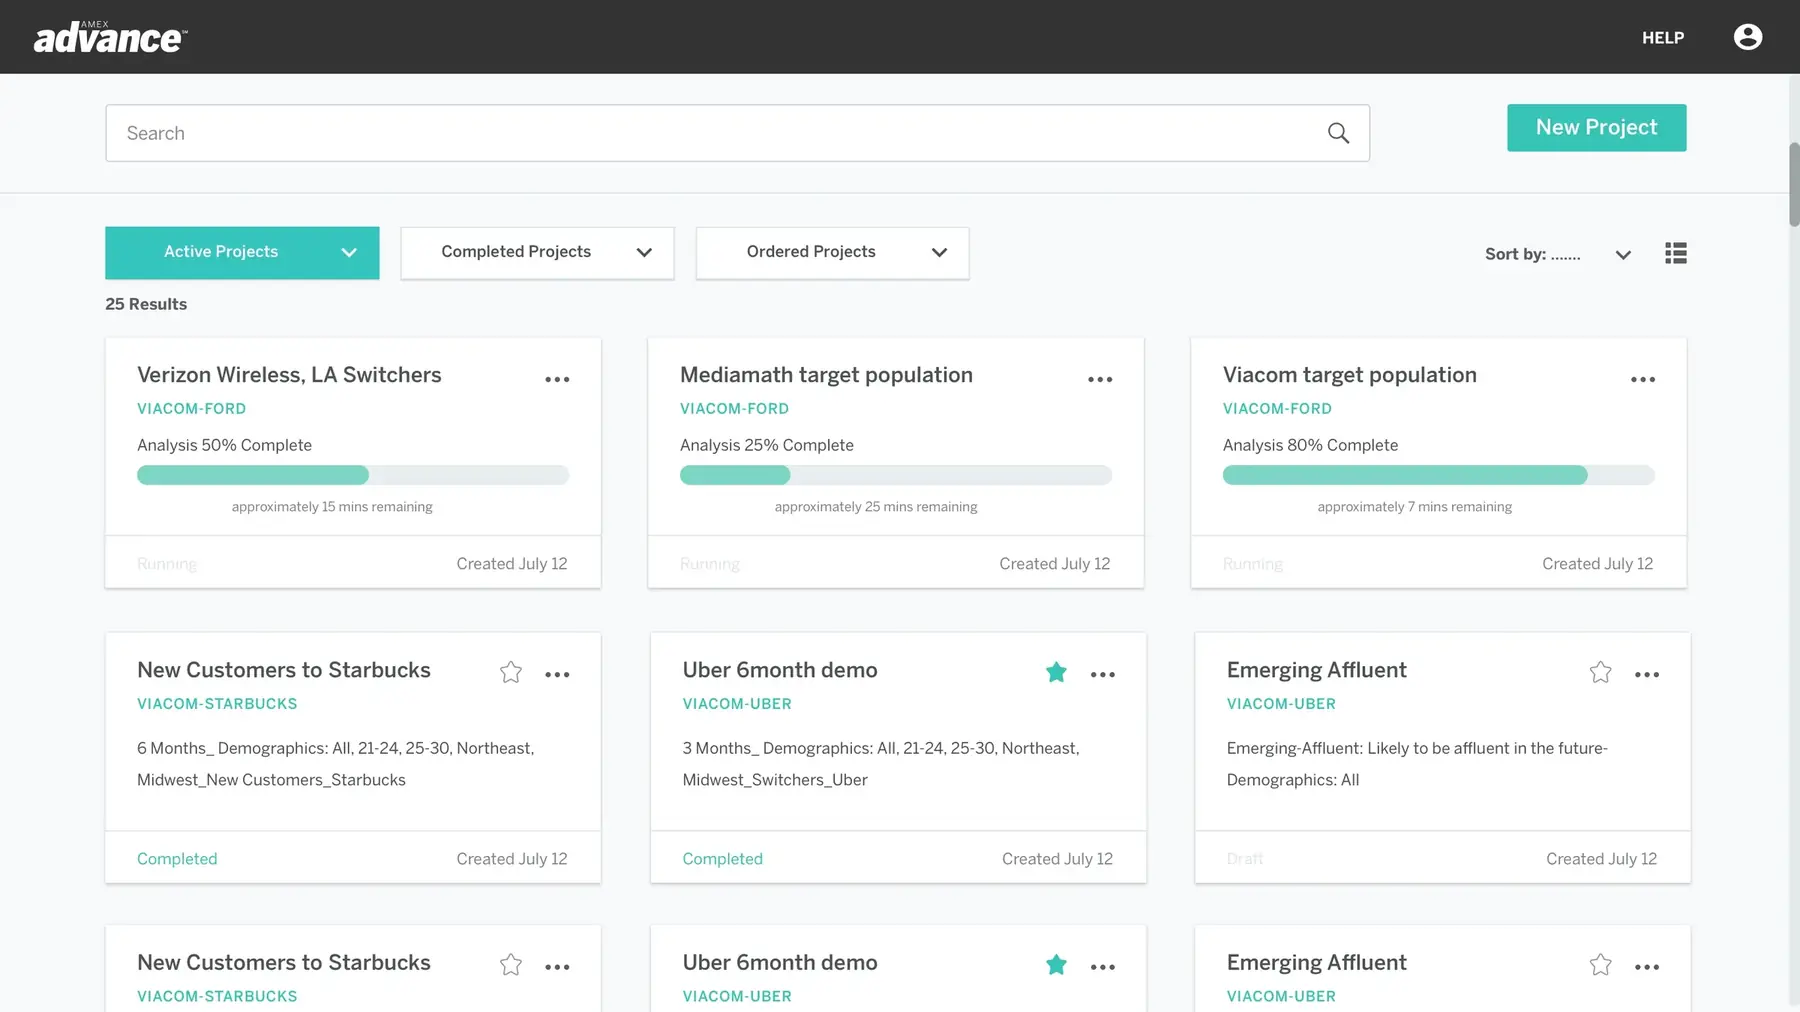
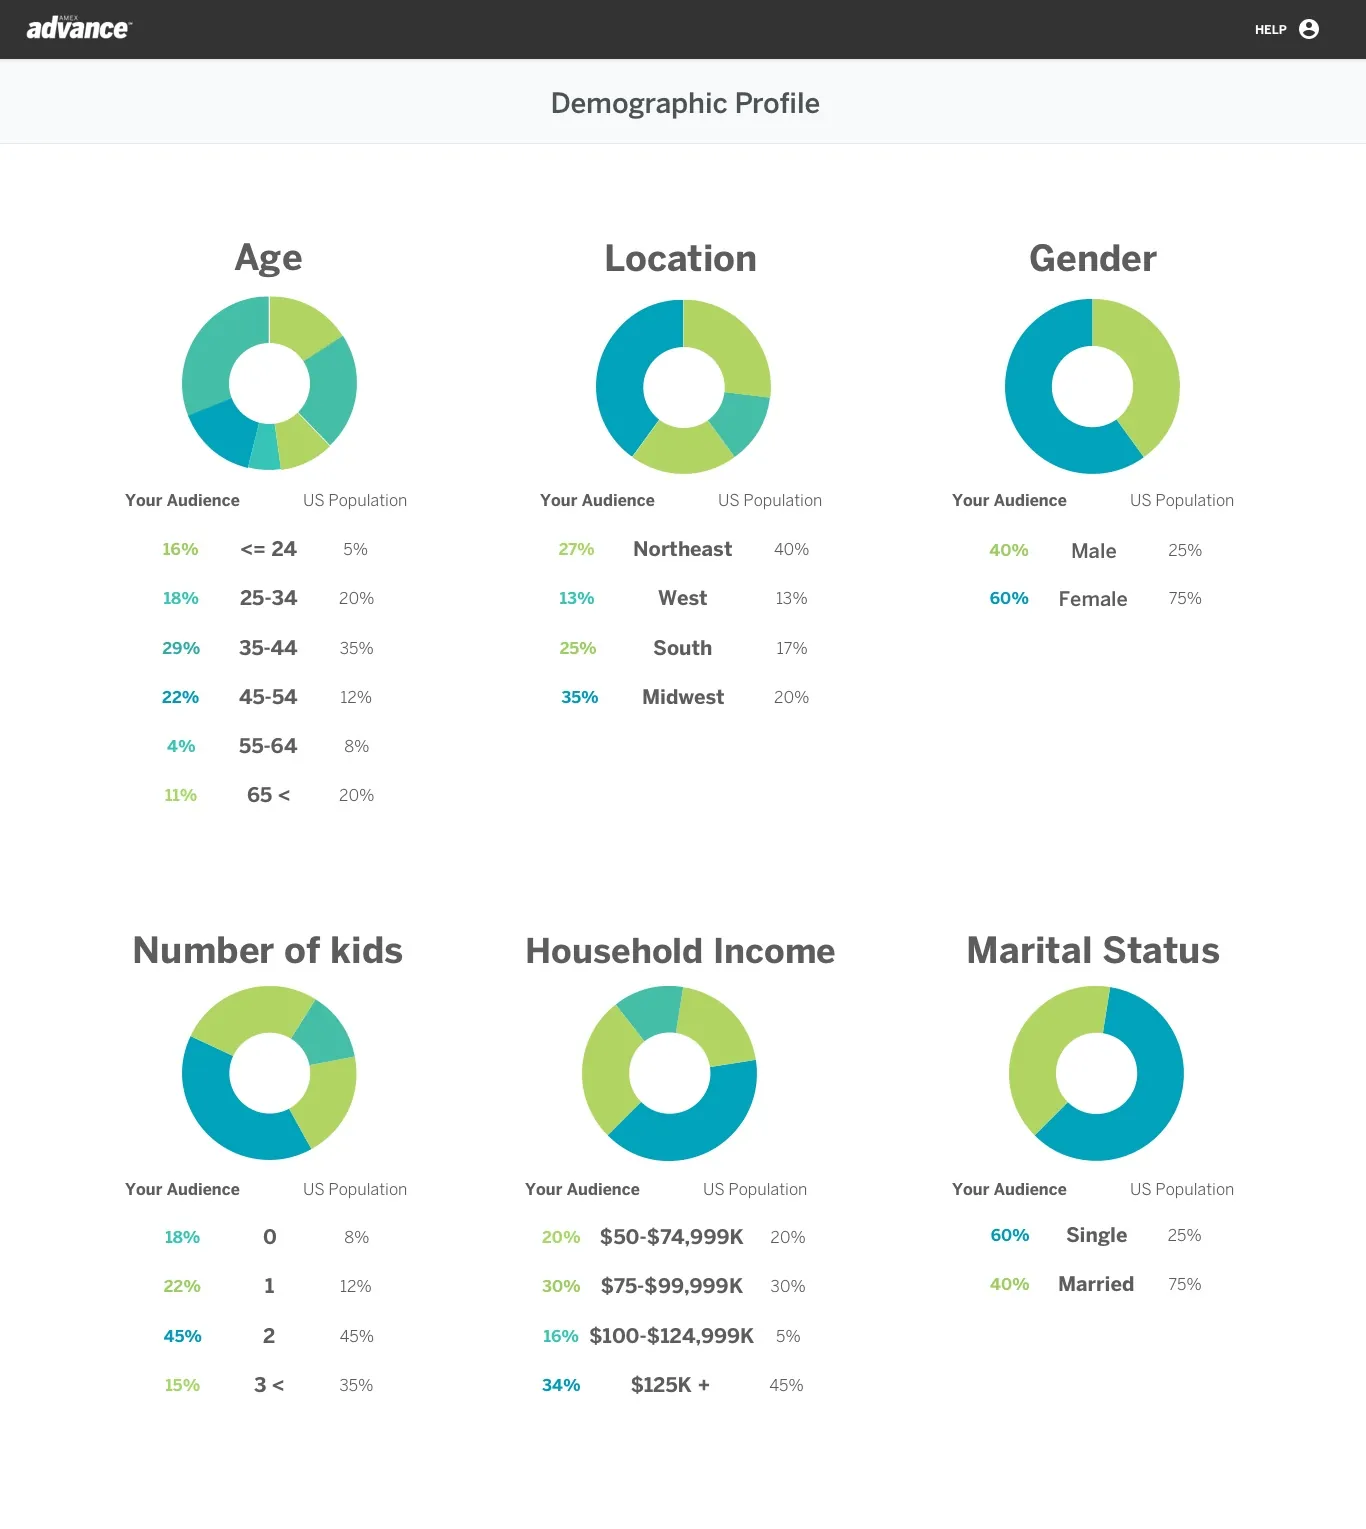
Enough detail to decide. Always a sense of where you are.
The final interface gave partners enough detail to make an informed call while always showing them where they were in the journey.
07 · RESULTS
Amex Advance brought audience creation, predictive insights, performance analysis and audience ordering into one connected workflow. It also gave the team a visual and interaction foundation that could grow with new reporting and optimization features.
15%
more efficient data analysis
12%
faster decision making
8%
higher stakeholder adoption of the data tools
08 · WHAT I TOOK FROM IT
Complex products don't need to hide their depth. They need an order to it.
Starting with the decisions people had to make, instead of the data we had, gave the whole team a shared test for every feature request. I've used that test on every complex product since, from payroll at ADP to financial journeys at Prudential.